The following analysis of select counties of the Idaho real estate market is provided by Windermere Real Estate Chief Economist Matthew Gardner. We hope that this information may assist you with making better-informed real estate decisions. For further information about the housing market in your area, please don’t hesitate to contact your Windermere Real Estate agent.
Regional Economic Overview
Employment in Idaho rose 3.2% over the past 12 months and the latest data shows the number of jobs is 38,300 higher than the pre-pandemic peak. This is particularly notable as there are only nine other states that have exceeded their pre-Covid employment levels. The state unemployment rate was only 2.7%, down from 3.1% at the end of 2021, and lower than the March 2021 rate of 3.9%. There was a very modest decline in total employment between February and March of this year, but I do not see this as being an issue. The labor force continues to grow, and my current forecast calls for employment to rise 3% in 2022.
Idaho Home Sales
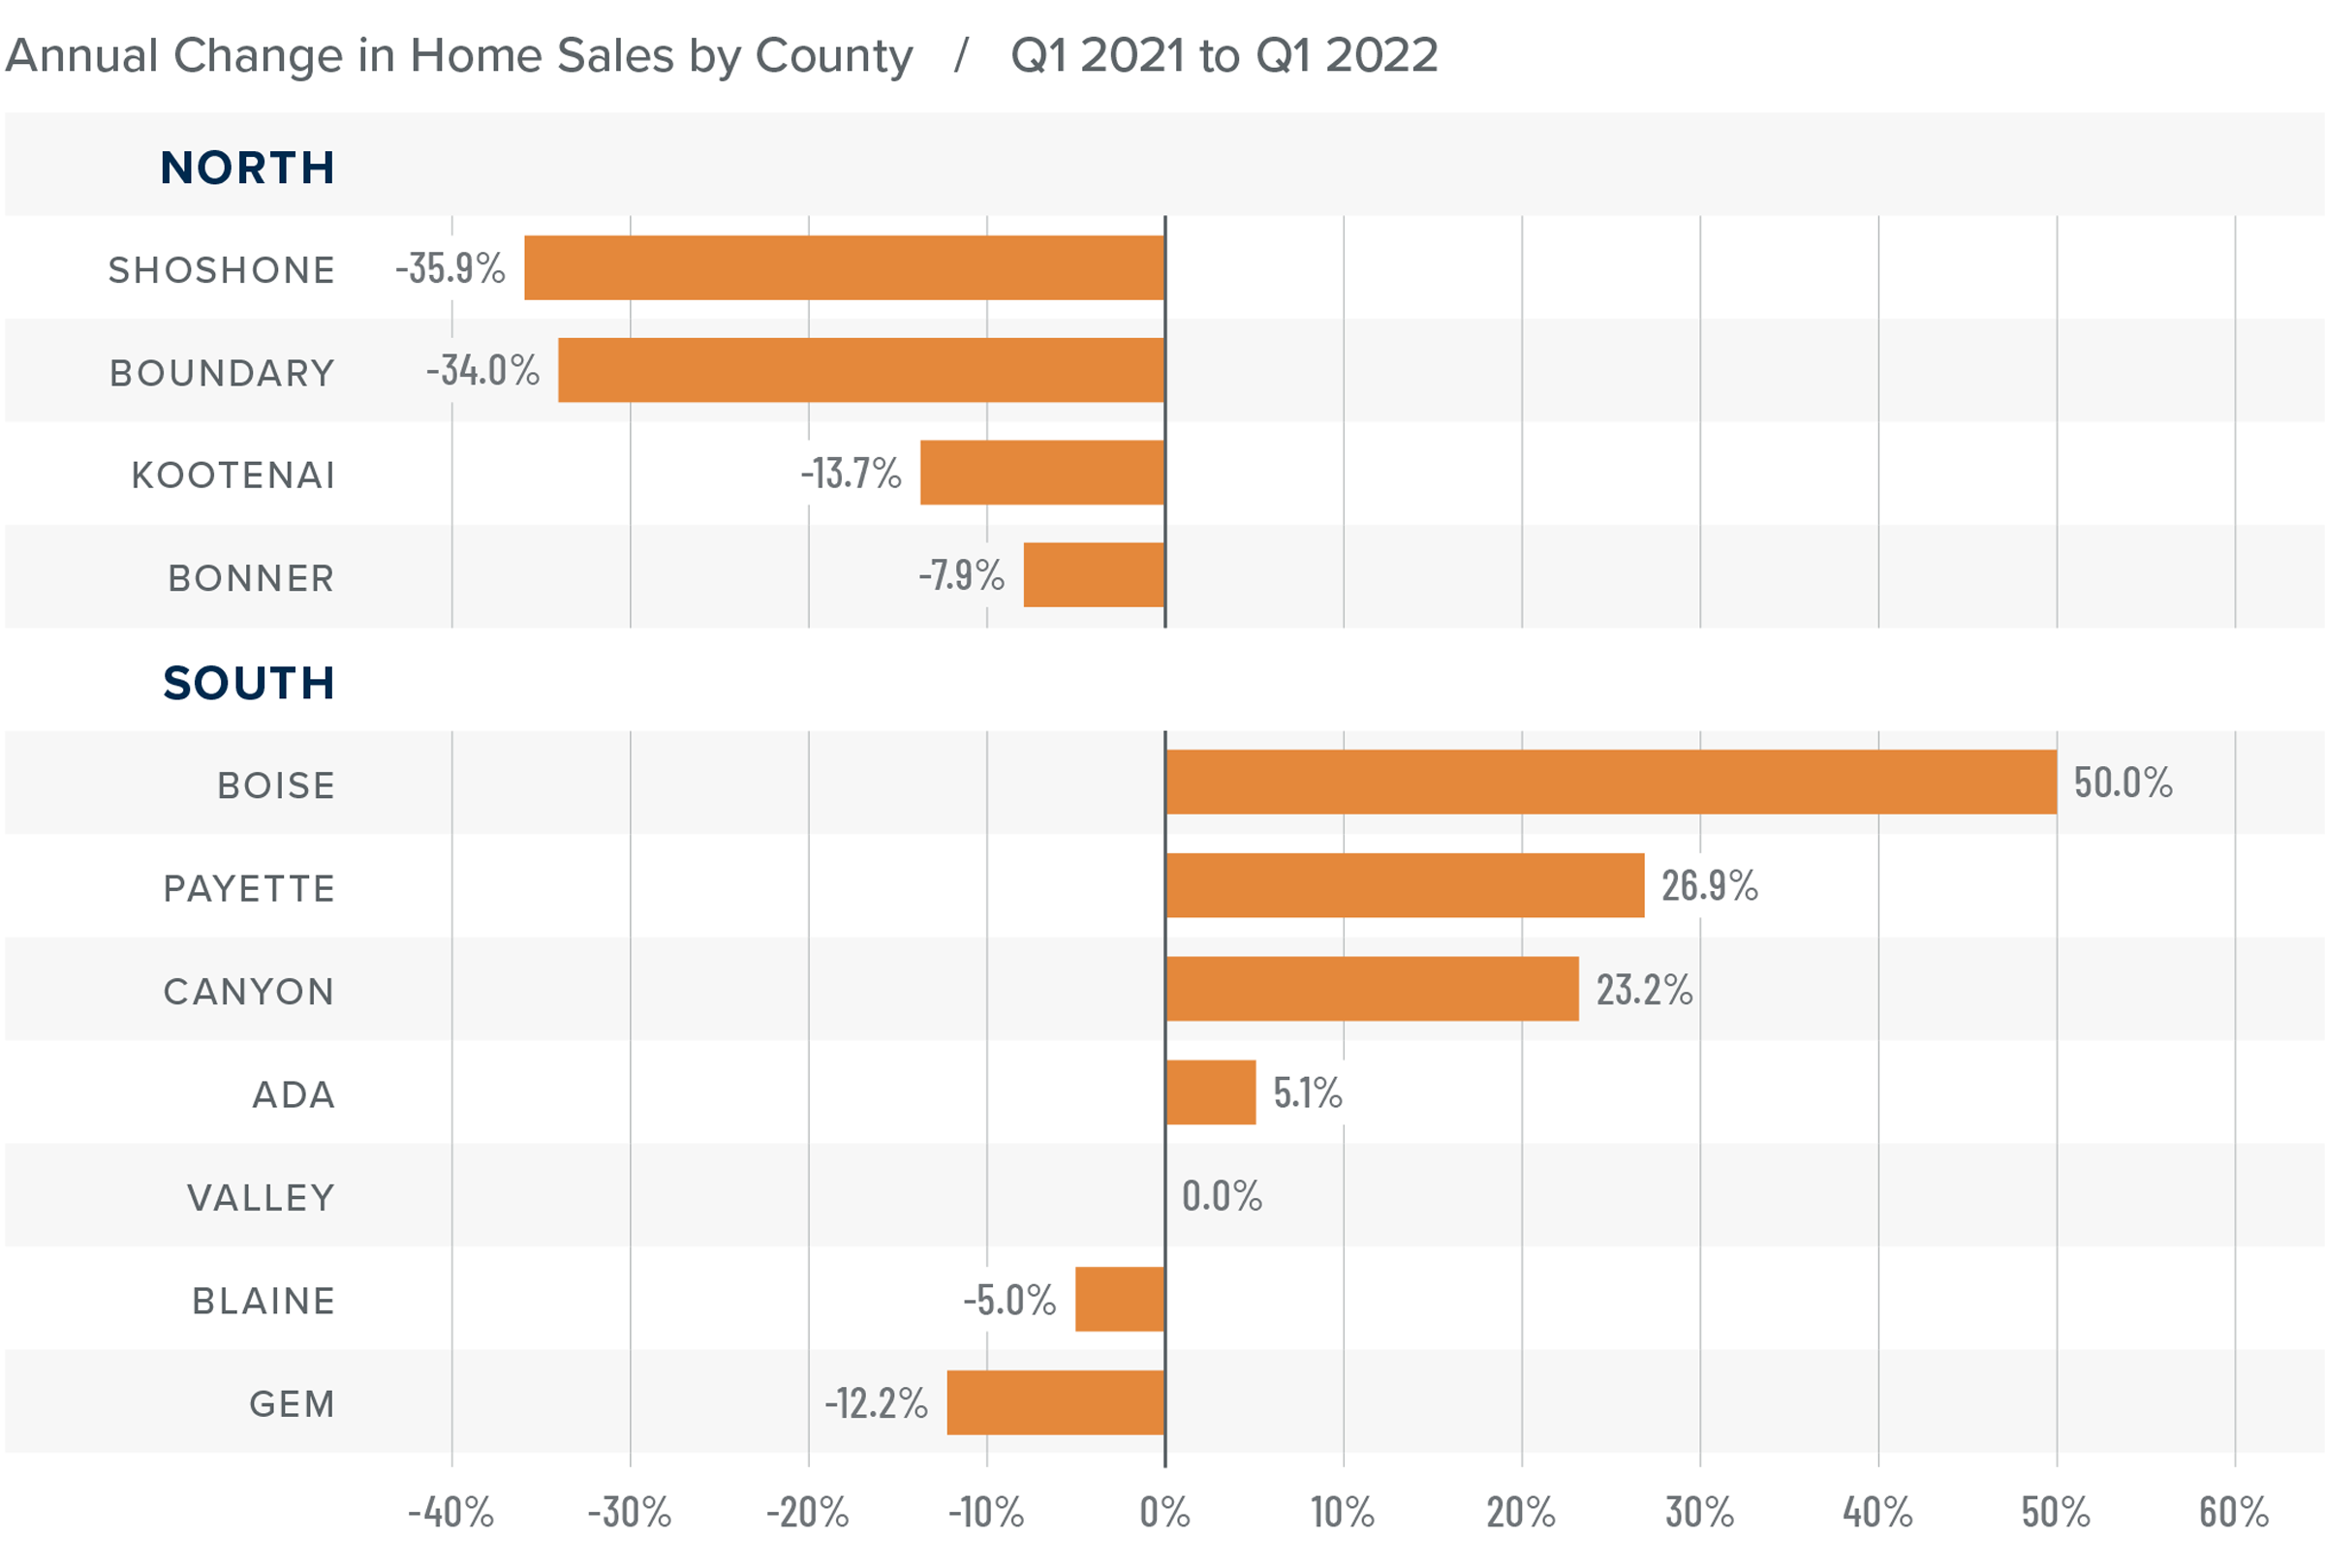
❱ In the first quarter of 2022, 5,183 homes sold, representing an increase of 4.2% compared to a year ago but 24.7% lower than in the fourth quarter of 2021.
❱ Quarter over quarter, sales fell in every county covered by this report.
❱ Sales fell in all the northern counties contained in this report compared to a year ago, but this was offset by rising sales in more than half of the counties in Southern Idaho.
❱ Pending sales were 2.7% lower than in the fourth quarter of 2021, but this is more than likely a function of inventory levels, which were down 28.4% from the last quarter. Supply is still very tight.
Idaho Home Prices
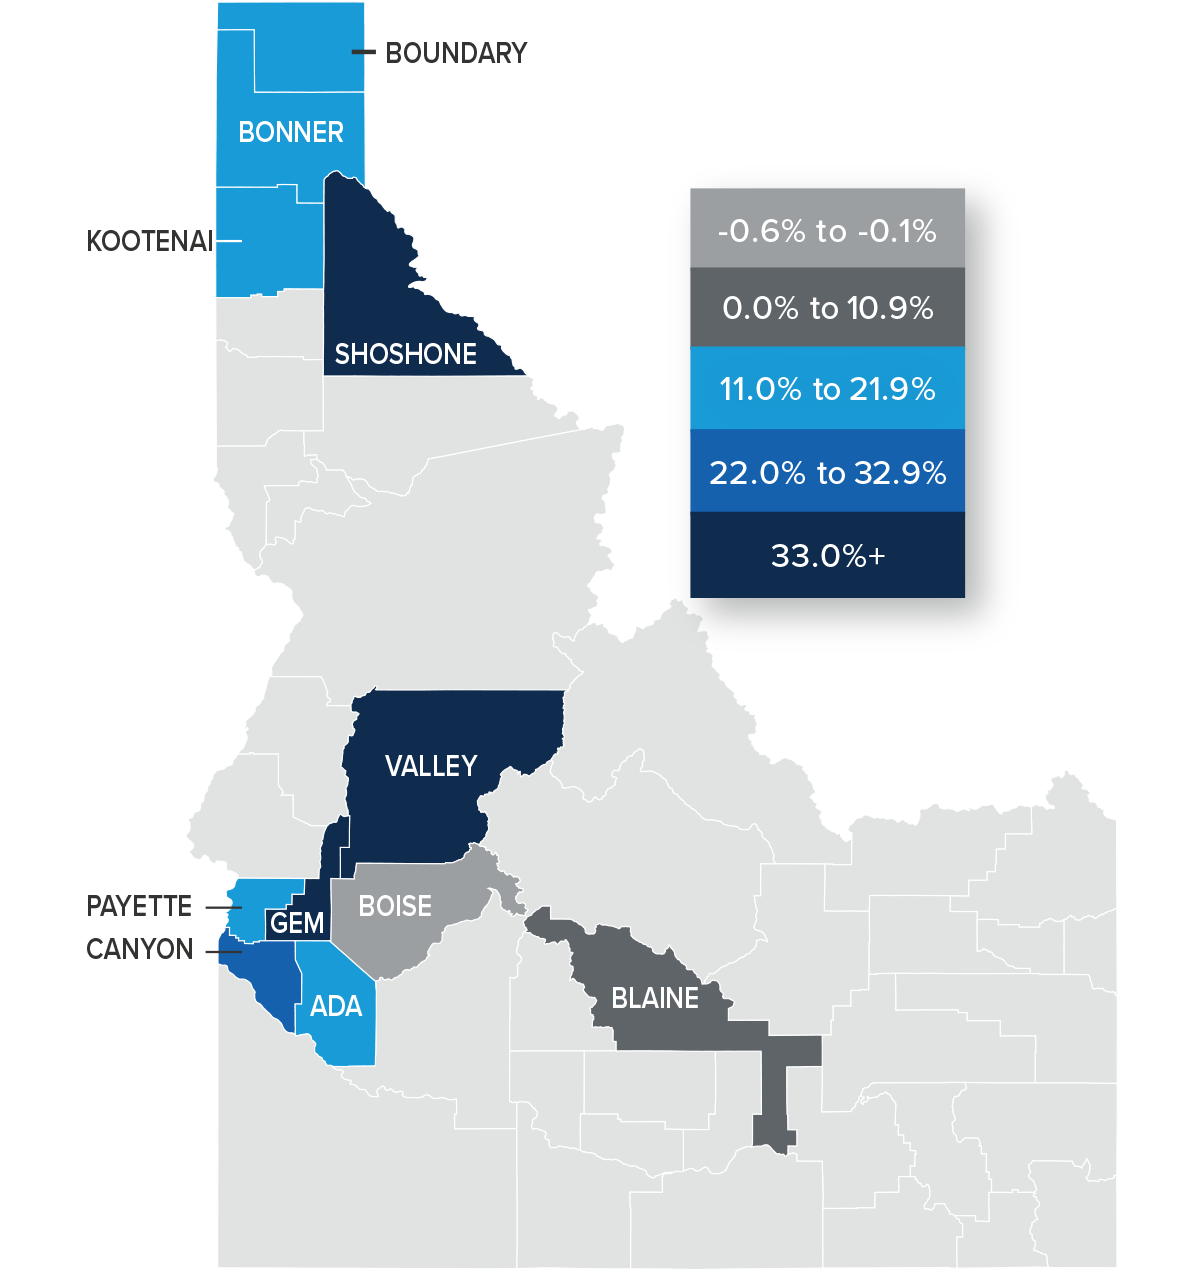
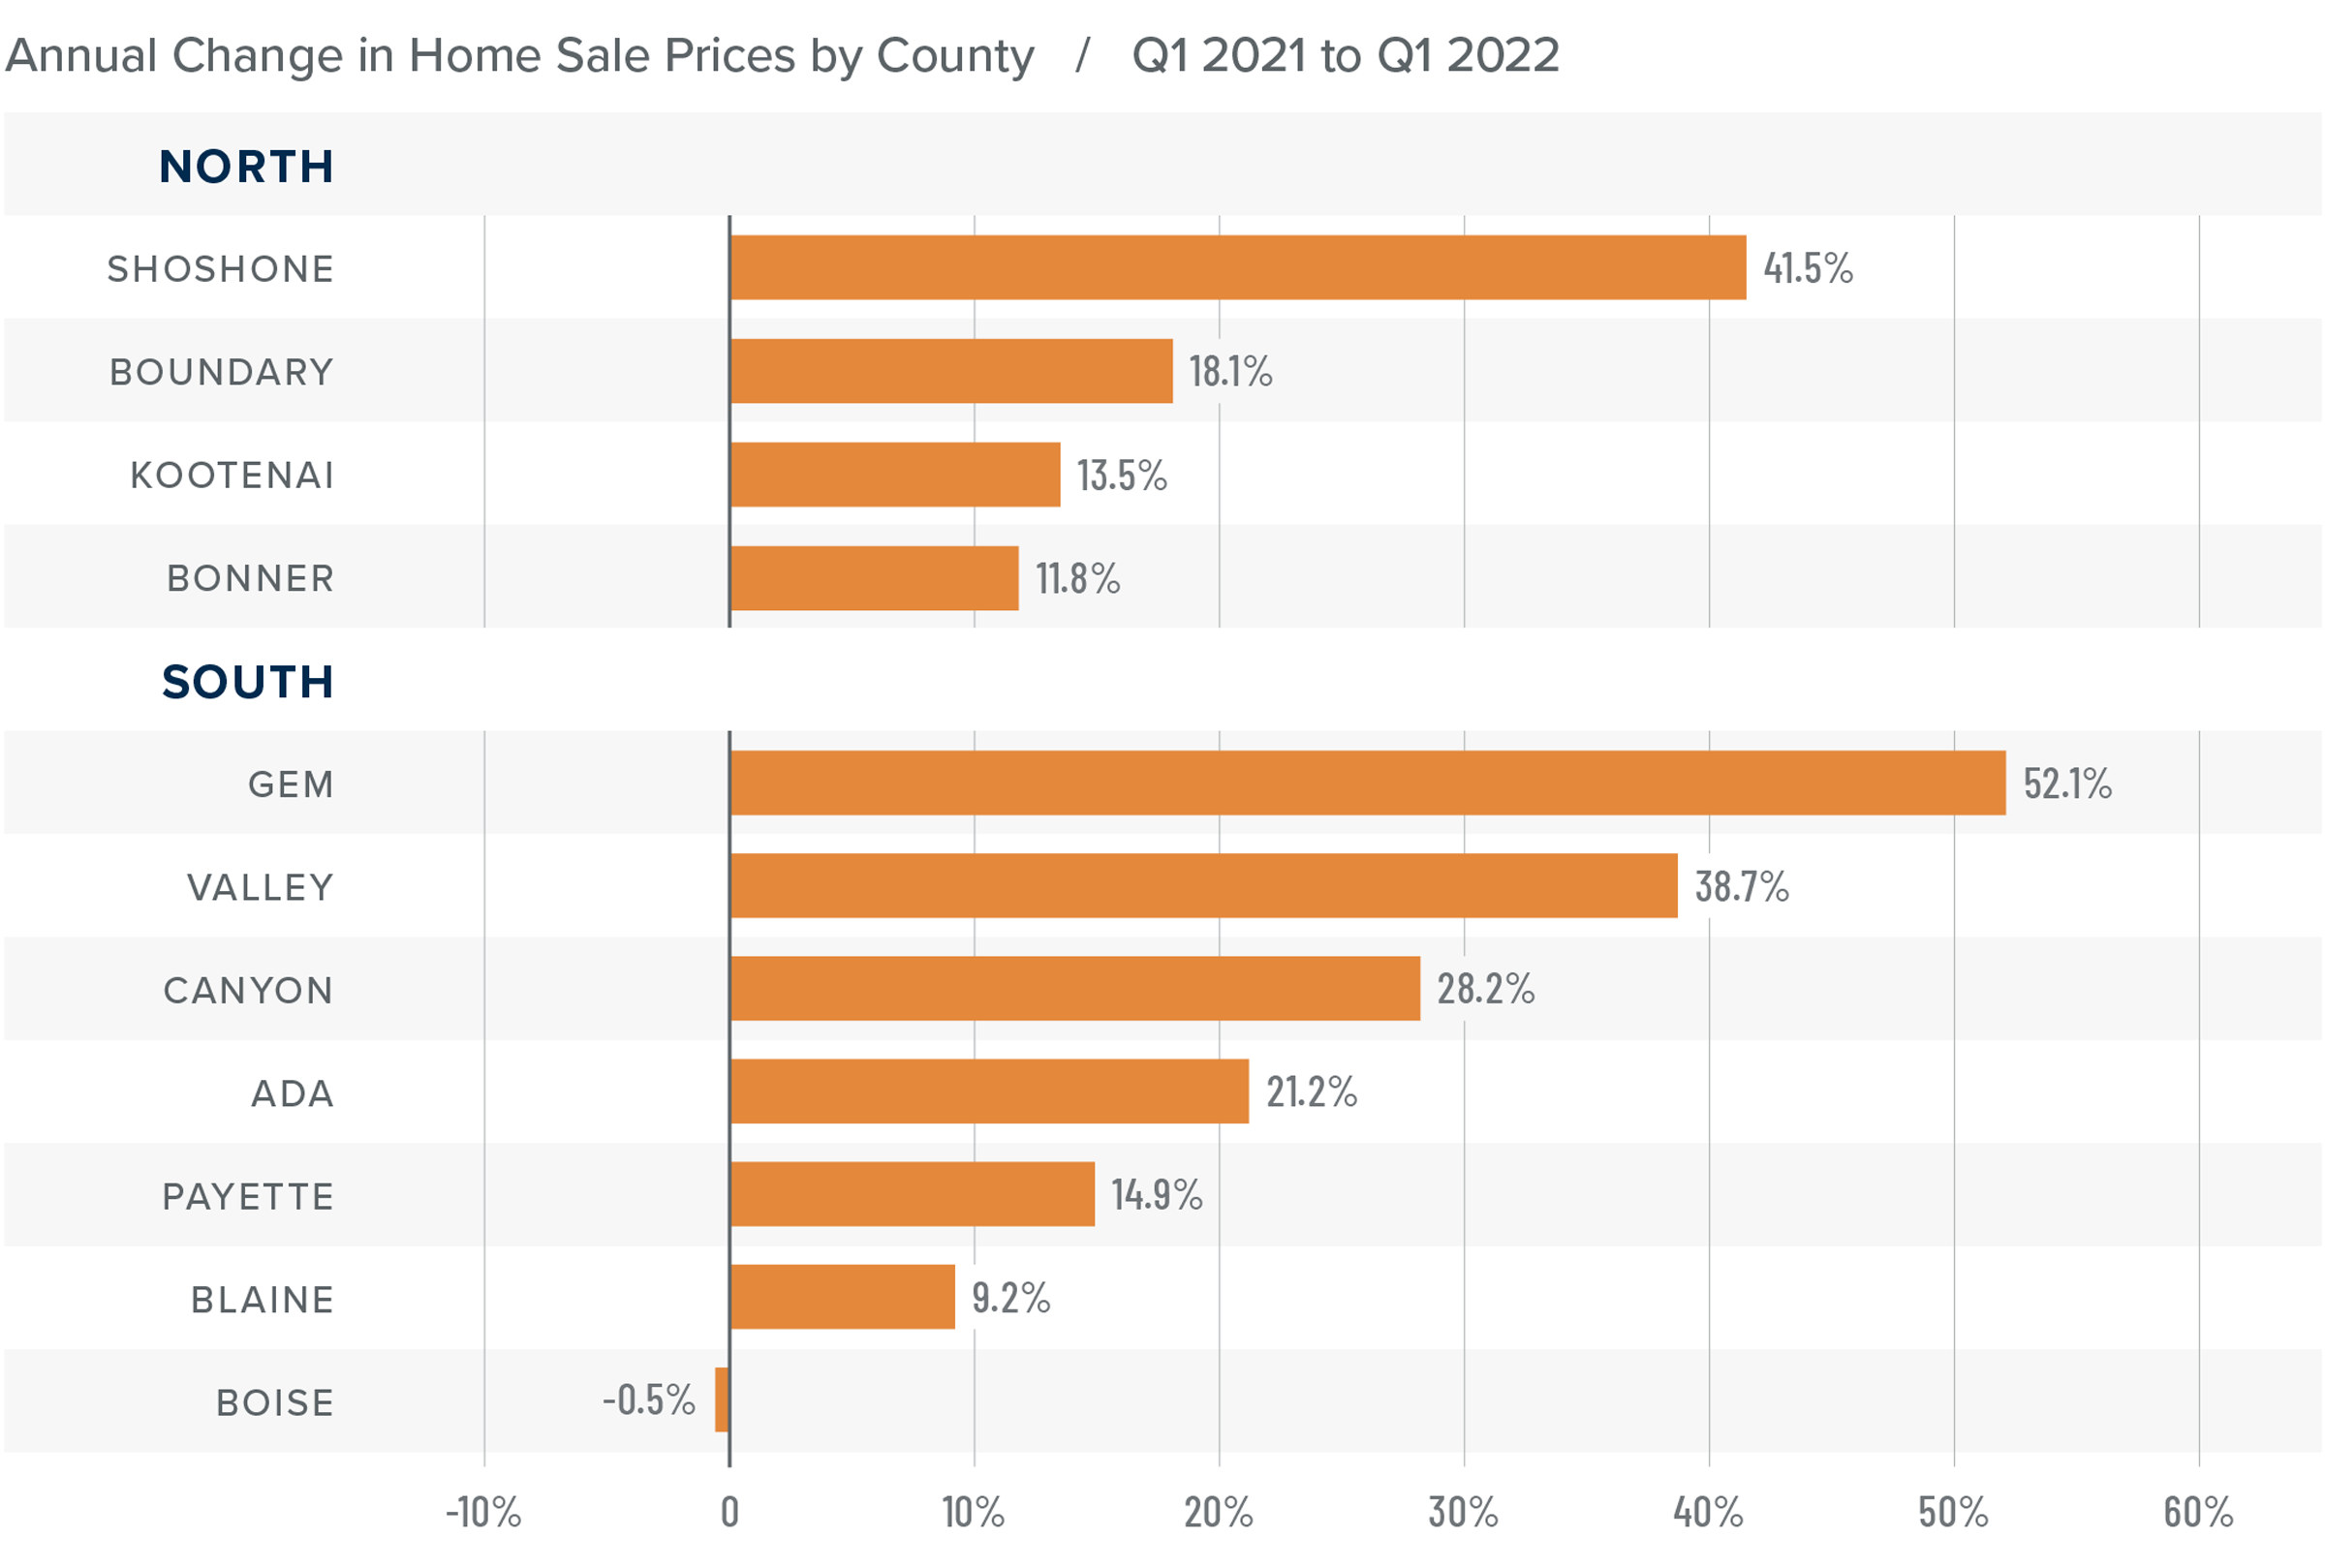
❱ The average home price in the region rose 18.6% year over year to $612,558 and was 3.1% higher than in the fourth quarter of 2021.
❱ Compared to the final quarter of 2021, prices were higher in Kootenai and Shoshone counties in the north. All counties in the southern part of the state saw sale prices increase from the prior quarter.
❱ Prices rose by double digits in all the northern counties contained in this report, and all but Boise County saw similar robust price appreciation in the southern part of the state. In total, prices rose 17.2% in the Northern Idaho counties and 19.5% in the southern counties.
❱ The market appears to have either shrugged off the significant increase in mortgage rates in the first quarter, or the impact has yet to be felt.
Mortgage Rates
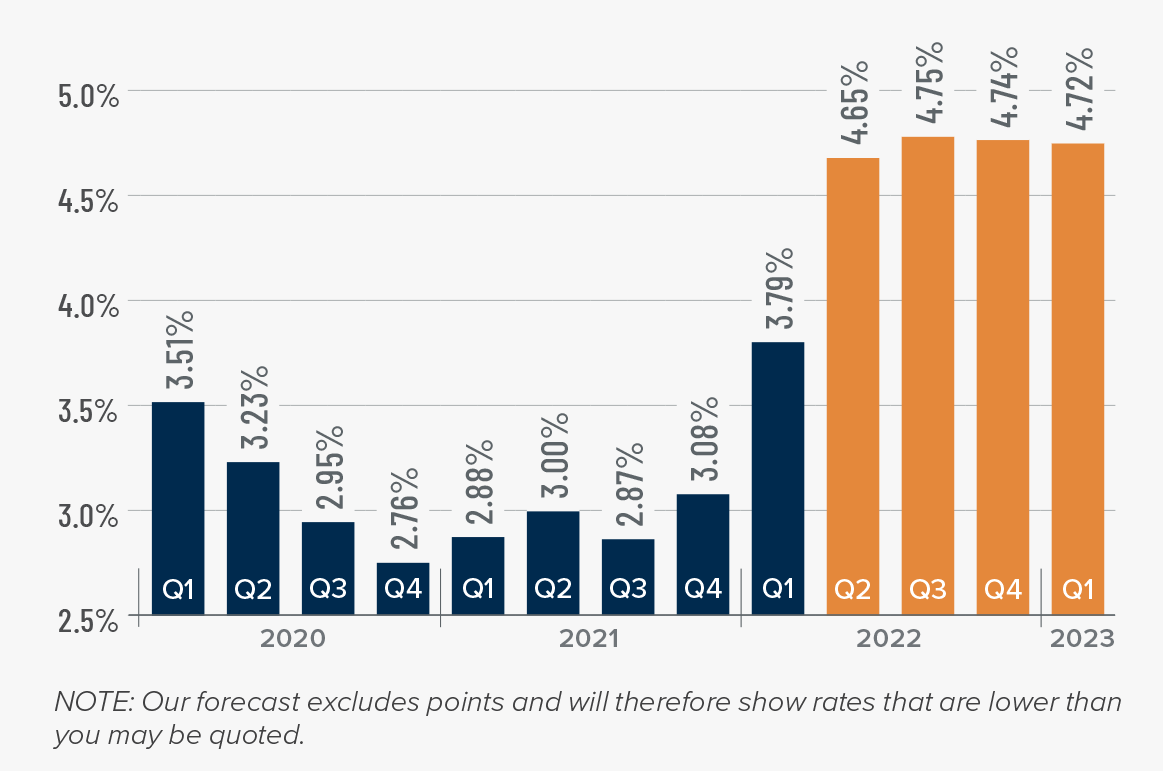
Average rates for a 30-year conforming mortgage were 3.11% at the end of 2021, but since then have jumped over 1.5%—the largest increase since 1987. The surge in rates is because the market is anticipating a seven- to eight-point increase from the Federal Reserve later this year.
Because the mortgage market has priced this into the rates they are offering today, my forecast suggests that we are getting close to a ceiling in rates, and it is my belief that they will rise modestly in the second quarter before stabilizing for the balance of the year.
Idaho Days on Market
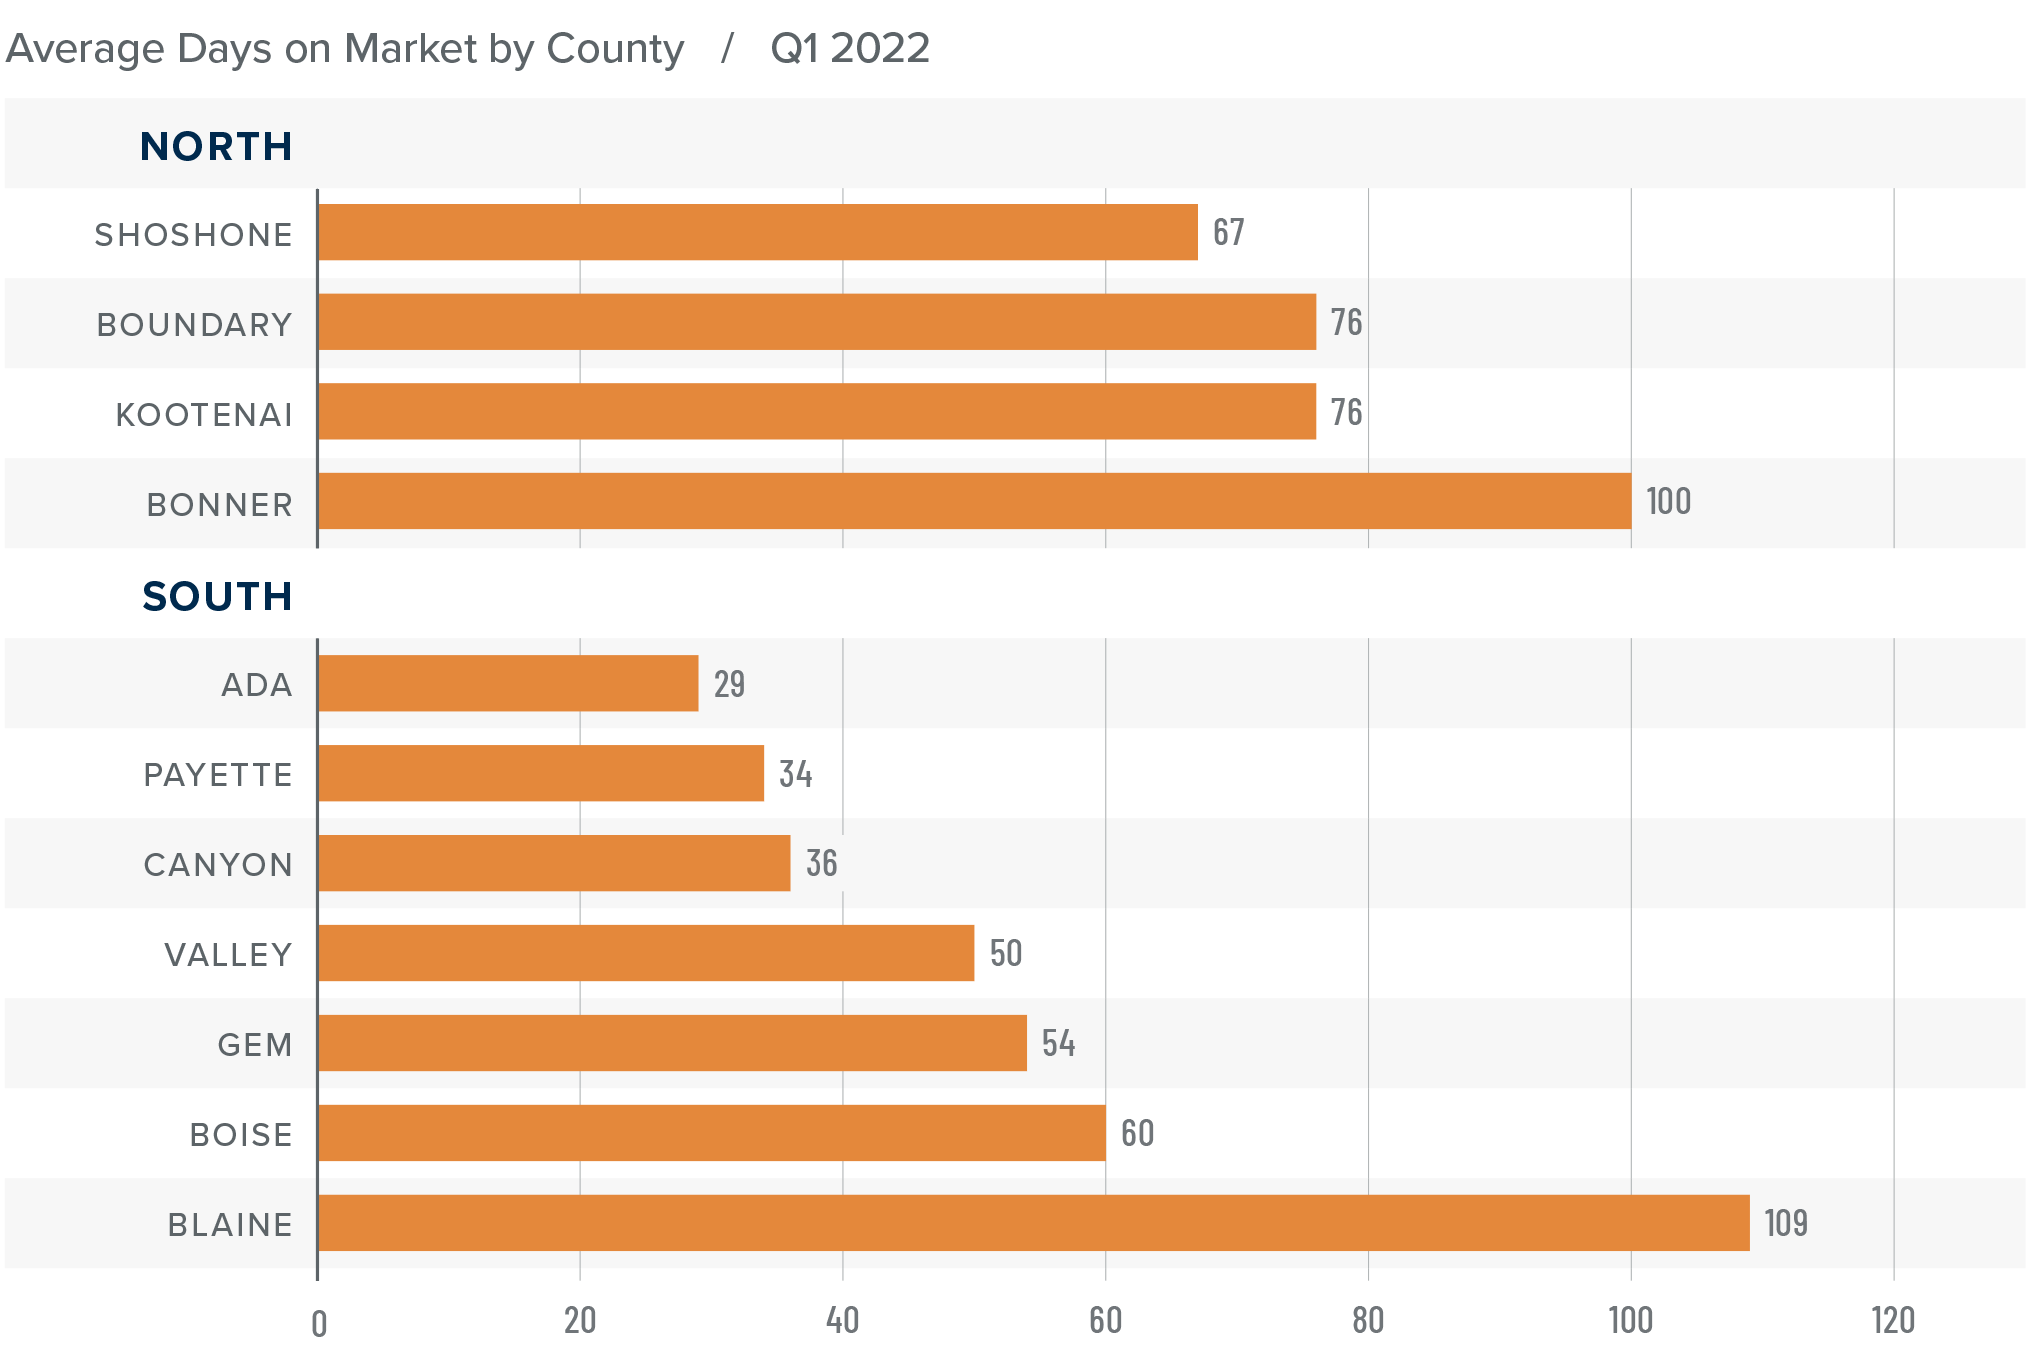
❱ It took an average of 80 days to sell a home in Northern Idaho, and 53 days in the southern part of the state covered by this report.
❱ The average number of days it took to sell a home in the region dropped ten days compared to a year ago but rose eight days compared to the fourth quarter of 2021.
❱ In Northern Idaho, days-on-market dropped in all counties from a year ago, and market time dropped or remained static in every county other than Bonner compared to the previous quarter. In Southern Idaho, average market time fell in all counties other than Canyon, Gem, and Ada compared to a year ago but rose across the board compared to the prior quarter.
❱ Homes sold the fastest in Ada County in the southern part of the state, and in Shoshone County in Northern Idaho.
Conclusions
This speedometer reflects the state of the region’s real estate market using housing inventory, price gains, home sales, interest rates, and larger economic factors.
The strong Idaho economy has helped the housing market continue its upward trajectory. We should see more homes come on the market as we move into the spring selling season, but this is unlikely to be sufficient to meet demand. The question remains whether rising mortgage rates will impact the pace of appreciation that home prices have experienced in recent years. The data suggests that it has yet to be a factor, but we will have to wait and see what the spring market shows us.
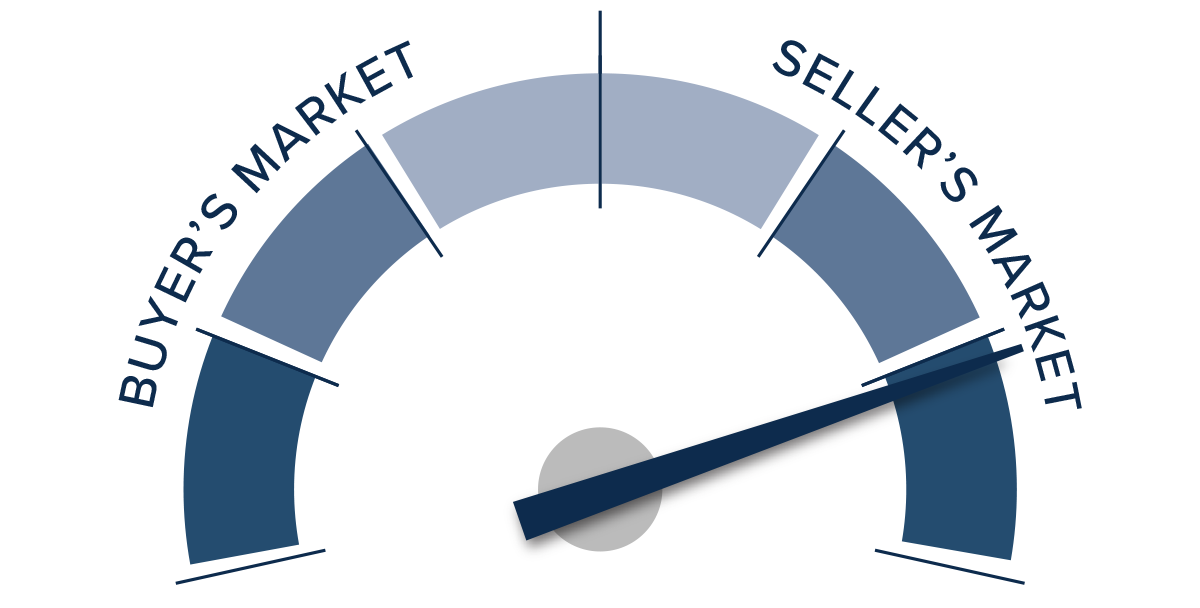
Given all these factors, I have decided to leave the needle in the same position as the previous quarter. It remains a strong seller’s market, but listing prices are softening somewhat in certain areas, which may be a pre-cursor to a slowdown in price appreciation.
By Matthew Gardner
Lake CDA Real Estate is a team of Coeur d’Alene real estate professionals committed to helping you elevate your quality of life. Whether you are buying, selling, or investing in Coeur d’Alene area real estate, we promise to provide you with 5-star service every step of the way.
FOR MORE INFORMATION ON THE COEUR D’ALENE AREA GO TO: https://destinationliving.co/
FOR A COPY OF NORTH IDAHO’S # 1 RELOCATION GUIDE PLEASE VISIT: https://destinationliving.co/reloguide/
SEARCH COEUR D’ALENE AREA LISTINGS HERE: http://100cda.com
Michelle Garcia & The Team at Lake CDA Real Estate, LLC Windermere Coeur d’Alene Realty, Inc. 208-699-5350


